Snapshot Data Panel

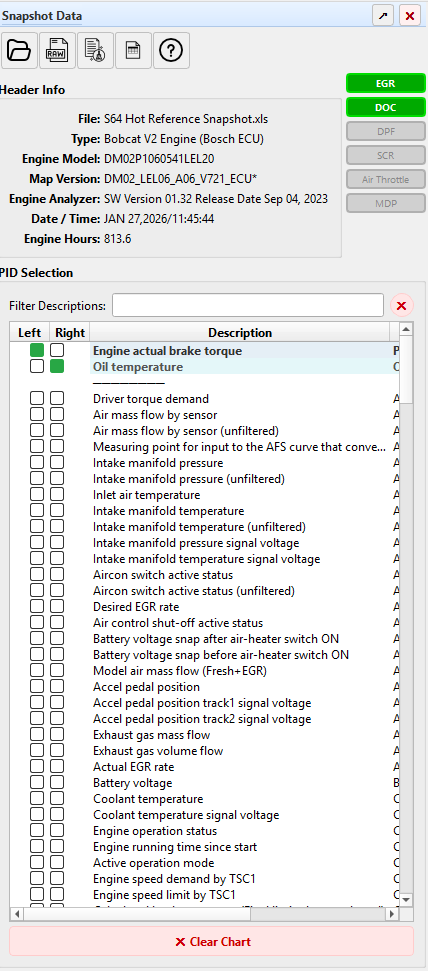
Snapshot Data panel overview

The Snapshot Data panel is the left-side dock that appears when you open a snapshot file. It is the central hub for viewing snapshot metadata, identifying equipped systems, accessing data tools, and selecting PIDs for custom charts.

The panel is divided into four main sections described below.

Quick Tip: The Snapshot Data panel is always accessible on the left side of the main window. If it is not visible, open a snapshot file with Ctrl+O or click the Open button on the toolbar.

Clear Chart

At the bottom of the panel is the ✖ Clear Chart button. Clicking it deselects all PIDs and clears the chart, giving you a blank canvas to start a new selection.

Snapshot Toolbar

The toolbar at the top of the Snapshot Data panel provides quick access to commonly used actions.

Snapshot toolbar

From left to right, the toolbar buttons are:

IconActionDescription
Folder Open Snapshot Opens a file dialog to load a snapshot file (.xls or .xlsx). Keyboard shortcut: Ctrl+O.
Raw Table Raw Data Table Opens a window showing the unprocessed data exactly as it was imported from the snapshot file. Useful for verifying that a file was read correctly.
Clean Table Clean Data Table Opens a window showing the data after Snapshot Decoder has cleaned, parsed, and organized it. Column headers are PID names and rows are time-indexed samples.
Chart Table Chart Data Table Opens a window showing only the data for the PIDs currently plotted on the chart. Helpful for cross-referencing exact values at specific time points.
Info Help Opens this Help browser panel. Keyboard shortcut: F1.

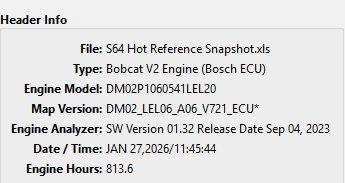
Header Info

The Header Info section displays key metadata extracted from the snapshot file. This information is read directly from the snapshot header rows and varies depending on the snapshot type.

Snapshot header information

Common fields include:

Note: Not all fields appear for every snapshot type. V1 ECU and V1 EUD snapshots may show additional fields such as serial number and MDP success rate, while V2 ECU snapshots include map version and engine model details. Snapshot Decoder displays whatever information is available in the file.

Snapshot Systems

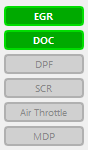
The Systems column appears to the right of the Header Info section. It shows which emission-related systems and subsystems are detected in the snapshot.

Snapshot systems indicators

Each system is shown as a small indicator label:

The systems monitored are:

SystemDescription
EGRExhaust Gas Recirculation – reduces NOx emissions by lowering combustion chamber temperature using recirculated exhaust.
DOCDiesel Oxidation Catalyst – oxidizes CO and hydrocarbons in the exhaust.
DPFDiesel Particulate Filter – traps soot particles from the exhaust stream.
SCRSelective Catalytic Reduction – uses DEF to reduce NOx in the exhaust.
Air ThrottleIntake air throttle valve installed in place of the EGR valve. Controls intake airflow to reduce combustion chamber temperature.
MDPMinimum Drive Pulse – injector performance metric (V1 snapshots only). When present, the indicator also displays the calculated MDP success rate percentage. The color reflects health: green (≥ 76%), yellow (51–75%), or red (≤ 50%).
Tip: The system indicators give you an instant overview of the engine’s emission configuration before you even look at a chart. If a system you expect to see is grayed out, the snapshot may not contain data for that subsystem, or it may be a different engine variant.

PID Selection

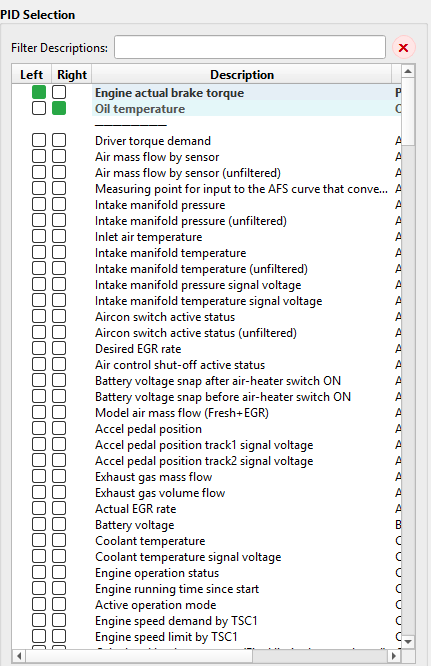
PID Selection list

The PID Selection section occupies the lower portion of the Snapshot Data panel. It lists every PID (Parameter ID) available in the loaded snapshot and lets you build custom line charts by selecting which PIDs to plot.

Filter Descriptions

At the top of the PID Selection area is a Filter Descriptions text field. Type any keyword to instantly filter the PID list. For example, typing coolant narrows the list to only PIDs whose descriptions contain that word. Click the button to clear the filter and show all PIDs again.

Left / Right Axis Checkboxes

Each PID row has two checkboxes:

Using dual axes lets you compare PIDs with very different value ranges on the same chart. For example, you might plot Engine actual brake torque on the left axis and Oil temperature on the right axis.

How it works: When you check or uncheck a PID, the chart updates immediately. Each PID is drawn as a colored line. The line color is shown in the checkbox cell so you can quickly identify which line belongs to which PID.

PID Column

The rightmost column shows a short PID identifier code for each parameter. This code corresponds to the internal identifier used in the snapshot file.